US equities had a magnificent bull run from the presidential election in late 2016 until January 2018. The broad-based S&P 500 index gained almost 40% whereas the Nasdaq 100 gained more than 50% during that timeframe. That’s almost half of a decade worth in equity gains within just a little more than a one-year timeframe. Market pundits were cheering and estimating more gains ahead. That occurred even very close around the January 2018 high. Pundits tried to justify the bull run by fundamental factors such as corporate tax cuts that were imposed by the Trump administration.
At the end of January investor were caught with their pants down. US equities started to sell off. The broad-based US equity indices lost more than 10% within just a couple of weeks. We were not caught by surprise. As a matter-of-fact, we warned that US equities are approaching a critical junction on January 26th 2018. That was exactly the day on which the S&P 500 peaked. The first two charts are screenshots from our Twitter timeline during that day. As it shows, we indicated our expectations of a drop. Moreover, those familiar with Elliottwave analysis can quickly see that we expected the market to rise to another all-time high after the drop.

Sentiment turned around as quickly as the market. Investors suddenly turned bearish. Market pundits quickly revised their bullish projections. Suddenly, permabears popped up all over the place again. They felt their victory and wanted everybody to know that they have been right. Of course, they stressed that they knew this was all going to end very badly. Parallels to the crash in 1987 popped up here and all across financial media. Many traders and investors expected the drop to follow through to the downside and extend into a fully fledged bear market.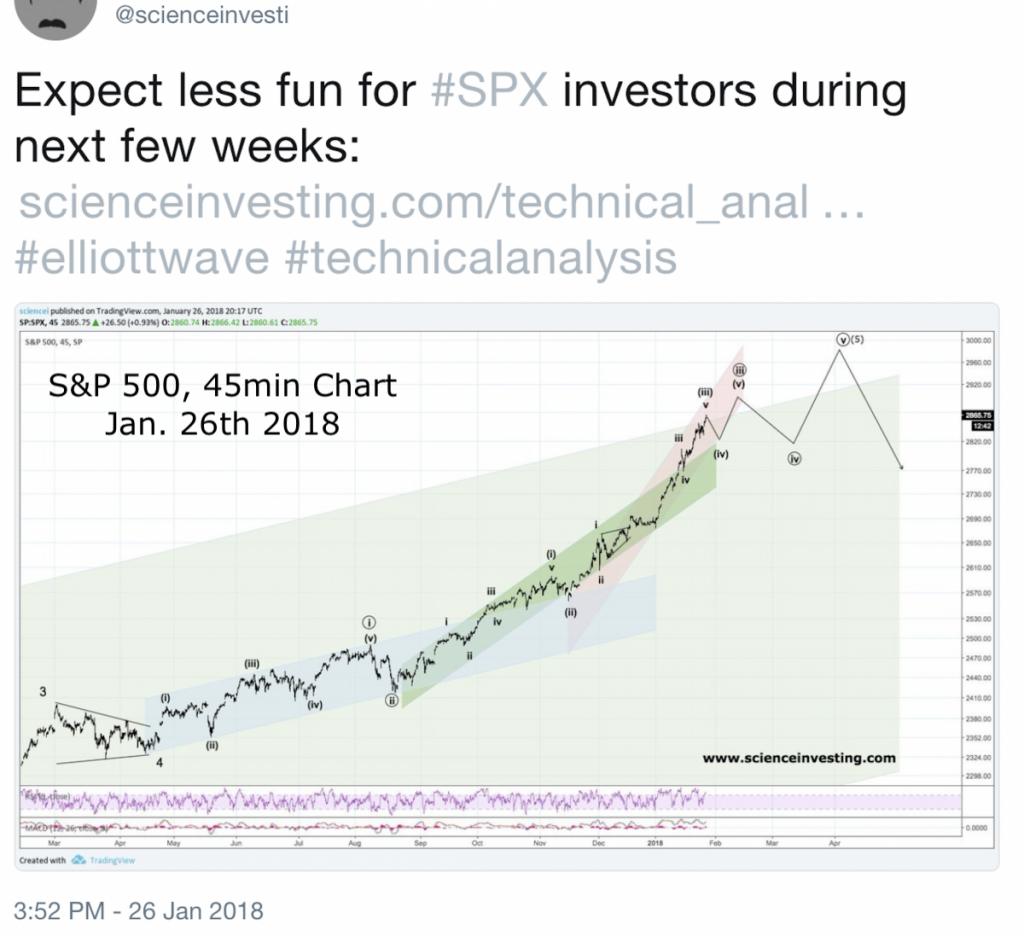
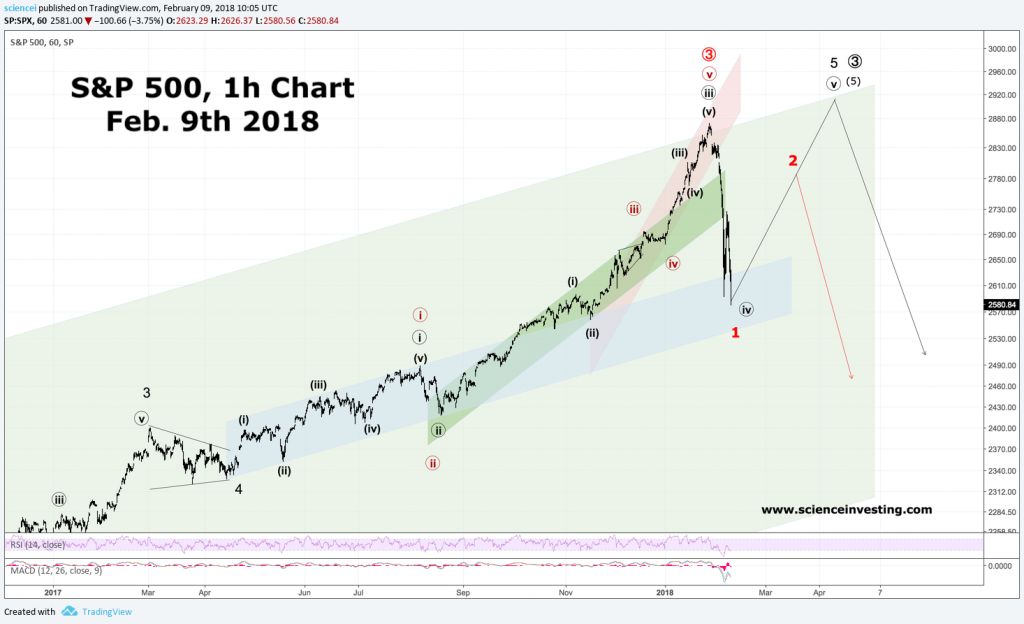
Once again, we made an unpopular forecast. On February 9th 2018 we called a sharp rally and made the case to buy-the-dip. It was right at the peak of the storm. Many others were fearing a crash and were afraid to catch the falling knife. We made a high confidence forecast that the S&P 500 would at least revisit the 2,700-2,800 area even if our base-case scenario of another all-time high proves incorrect. Markets started rallying within a few hours of our publication. Our forecast got confirmed regarding both, a sharp rally and a new all-time high. The S&P 500 reached a new all-time high in August 2018.
Our analysis attracted wide attention back then. People were wondering how we reached our conclusions. Again, it was neither magic nor pure luck. It was a combination of knowledge, hard work, and being fortunate enough to interpret the big picture correctly. It was the combination of technical analysis, especially Elliottwaves, with modern macroeconomics. Cyclical blow off tops and bottoms have been very rare in history. Less than 1 out of 10 cases recorded a sudden and complementary turnaround worldwide. Usually, some shoe drops first. Look for example at the great recession during the late 2000s. The subprime market exploded, interbank lending dried up completely, and equities were chasing one all-time high after another. That wasn’t fitting neatly into a healthy macro picture, was it? The macro picture in early January was quite different. It looked healthy. The technical picture was not hinting to a broad-based cyclical turn as well. Wave structures on the major US indices were simply not terminal. Moreover, momentum readings were also very untypical for significant reversals. All in all, the overall picture suggested that a cyclical turn is very unlikely. We assigned less than 5% odds to that and concentrated entirely on identifying a buy-the-dip opportunity. Neither magic nor luck led to our conclusions. A systematic decision-making approach was responsible instead!
Global equity markets are approaching a critical junction again. This time, some signs, which haven’t been in place during the February sell-off, look different. That’s the subject of discussion in our premium analysis of equity indices.