The Taiwanese blue-chips index flatlined since October 2017. There was no net price progress for about a year. The index just showed a sideways correction. It is most likely a correction within a bull market that started in 2015. Bullish price action accounted for well above 50% gains and within just a couple of years.
Elliott wave analysis is also about specific patterns that are typical for corrections. We may have one right here in front of us! There’s a high probability that we are looking at a triangle. What do triangles do?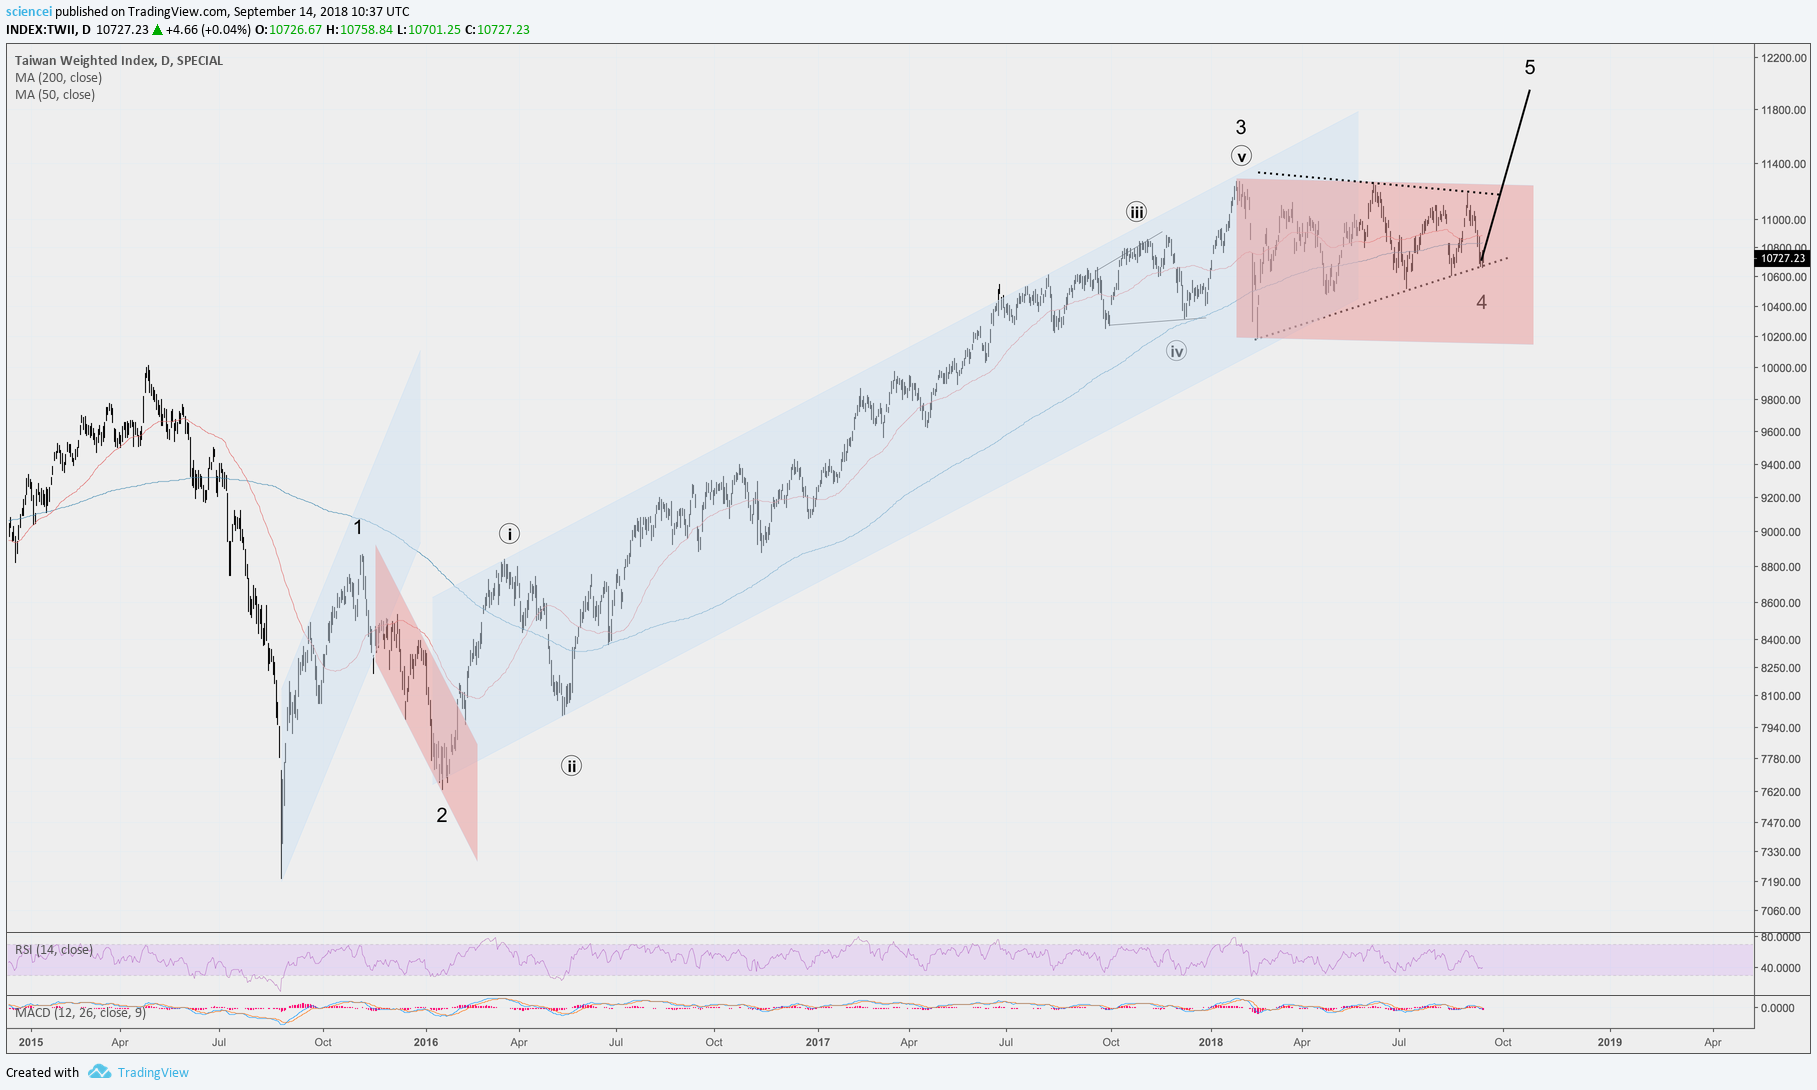
Triangles resolve in the direction of their paramount (bigger) trend according to Elliottwave theory. Moreover, they typically proceed the last action of the paramount trend.
Hence, we probably have a decent risk reward swing / position trade right in front of us. The lower dotted contraction line can be used is a gauge whether the pattern is invalid. The upside potential is much bigger than a drop below that support!
Want more ideas? We point to potential setups regularly in our premium analysis.