Our neutral stance on gold proved correct so far. We’ve forecasted a correction in the neighborhood of 5%-7% from the swing high, which ended in February 2018. Price action took us right into that area already. The overall result is that gold has not made any progress since Christmas 2018.
We remain with our forecast that the current correction will bring an attractive entry opportunity. Gold is likely to push through the 1,350-1,370 area eventually. The final target is around 1,500. The initial kick-off is expected to happen within the next few weeks. The mid-term pattern remains challenging, but its next leg is most likely up. Sentiment cooled down remarkably during the past few weeks. Therefore, a triangle pattern appears most likely. It unfolds within the pale red sideways trend, which is about to end. We’ve labeled it as intermediate wave (X).
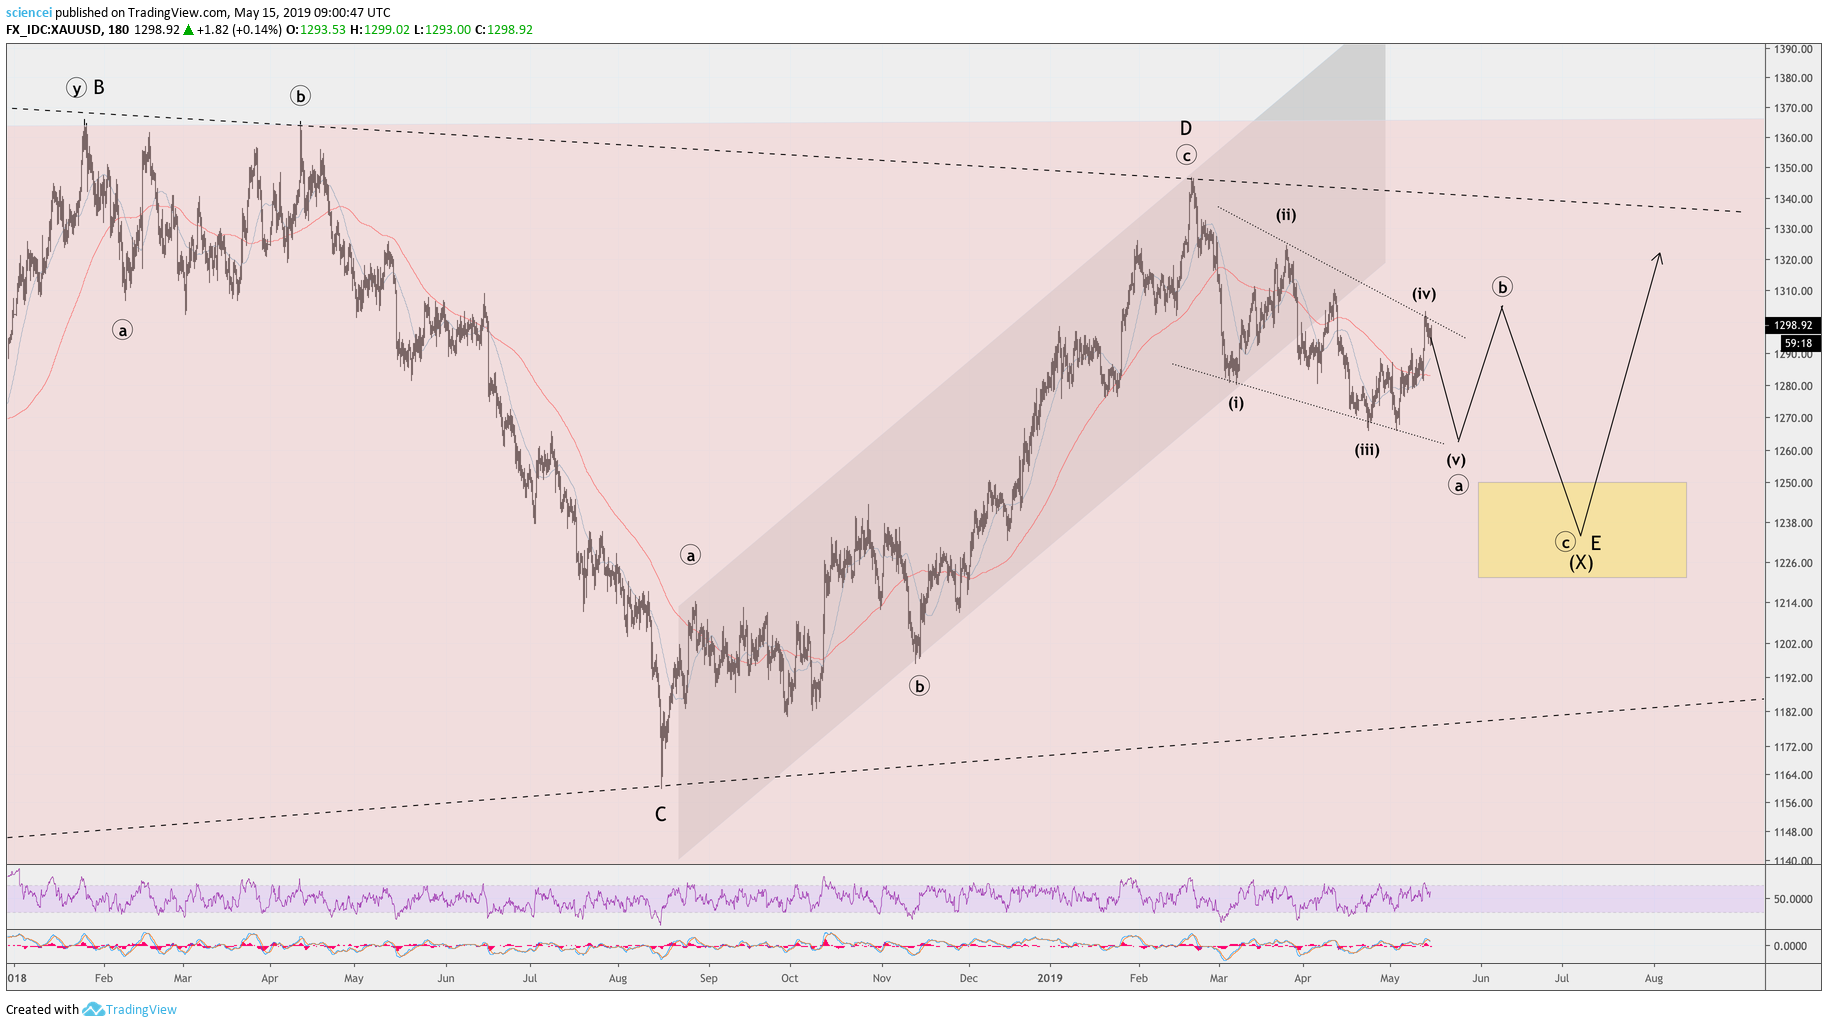
The final pullback within the pale red sideways trend probably takes some more time. The fractal within wave E is most likely incomplete at the time of this write-up. Another leg to the downside seems likely. The next big confluence area is within the 1,220-1,245 cluster. Price action oscillated more or less around this area for the past six years. We expect a triangle resolution from roughly that area. It is highlighted by the yellow box in the short-term chart below.
Interested in precious metals? Gold is among our main products and discussed regularly. We focus on its cyclical trends and weekly patterns in our premium analysis.