The website MacRumors has a trendy buyer’s guide for Apple products. They look at the average product cycle and show how much time passed by since the latest release. Products that reached a mature stage of their cycle are rated as a “Don’t Buy”. Cycle maturity is estimated by comparing the days that passed by since the latest release to the average product cycle length. The benefit for consumers is that they have an indication to wait or go ahead with their iPhone purchase. Those who seek the latest technology for their money can postpone their purchase if their product of interest has been released long ago.
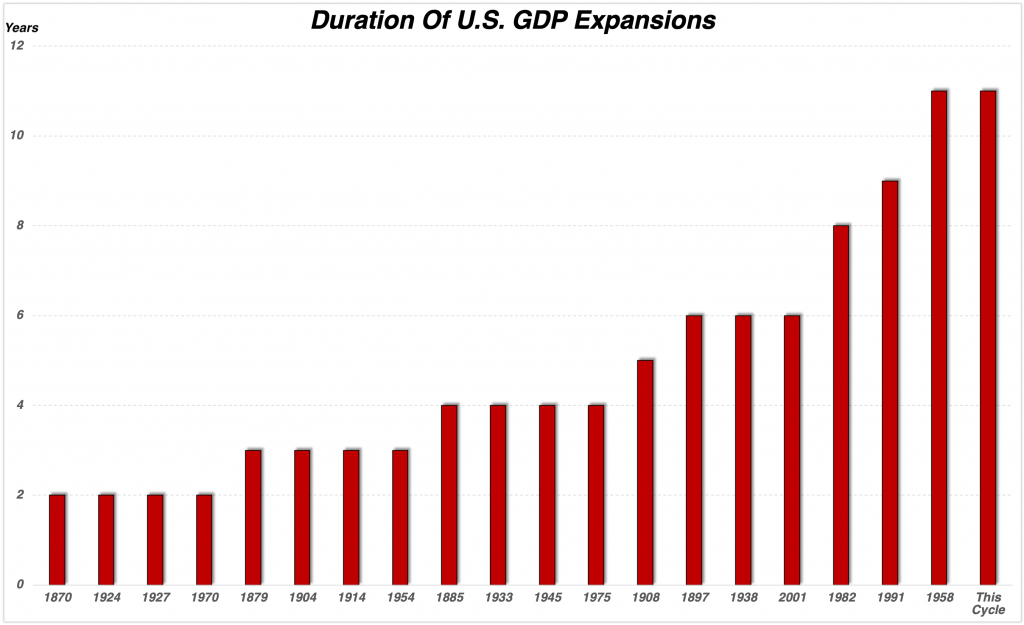
We can think of the MacRumors buyer’s guide as a simplified model of economic cycles. The business cycle, for example, shows some reliable patterns that repeat throughout history. It expanded most of the time in the United States, and the first chart shows the duration of 20 expansion cycles since 1870. These lasted on average four to six years, and today’s expansion, which started at the end of the global financial crisis, is the longest recorded expansion in U.S. history. That is clearly a “Don’t buy” rating in the MacRumors methodology. Still, economic analysis supports the potentially oversimplified verdict as well.
Three macroeconomic indicators have a reliable track record for pinpointing cyclical downturns. Labor market conditions, the yield curve, and the Conference Board Leading Economic Index (LEI) did a terrific job in forecasting the past ten recessions in the U.S. These indicators rang the alarm before every recession since 1950. Moreover, their precision has been close to that of a Swiss watch. Altogether, these indicators flashed 46 correct and only one false signal since 1953. Last but not least, they signaled an economic downturn most often ahead of the stock market.

The second chart summarizes U.S. labor market conditions over the past 70 years. It plots the unemployment rate along with official NBER recessions in grey and labor market strength in black. A couple of stable long-term patterns become apparent from the unemployment data. First, the unemployment rate marked a cyclical low ahead of every recession. Second, the labor market behaves like a big oil tanker that runs at full speed and needs to stop. The vessel does not come to an abrupt standstill but loses speed gradually. The same applies to the labor market as the black indicator at the bottom reveals. A slowing labor market kicks in before the economy falls into recession. We can loosely view this deteriorating labor market strength as entering the late stage of the cycle. Labor market strength weakened about 16 months before the unemployment rate hit its absolute low historically. There has been only one exception, the 1973-1975 recession, out of the past ten recessions that did not record a gradual deterioration of the labor market every month.
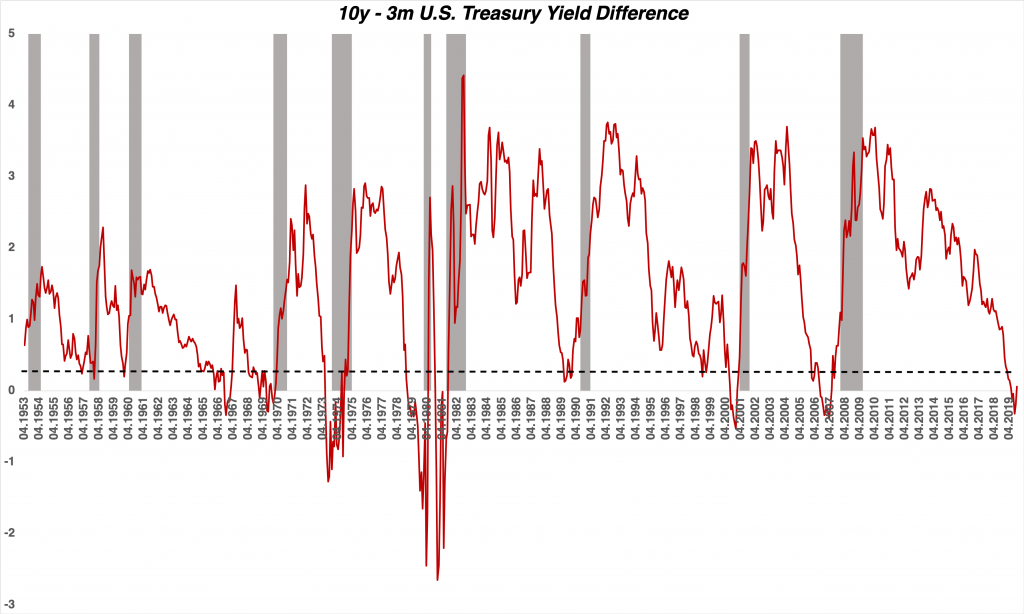
The chart above shows the yield curve as the difference between the 10-year and 3-month Treasury yield. The metric became particularly prominent in mainstream media earlier this year. The indicator proceeded a top in the stock market on average by five months. It took as long as 21 months during the last cycle until stocks eventually dropped. Notably, it was enough to reach a positive yield of 25 basis points and less measured by the difference in 10-year and 3-month Treasury yields to trigger a yield curve signal. The yield curve indicator produced only one false or an early signal ahead of the past ten recessions as it dipped below 25bp in early 1966. All in all, a flat yield curve has been a reliable indicator of economic downturns and stock market peaks. The signal has not been discarded at the time of this write-up despite the ongoing stock market rally. It triggered about nine months ago, which is ideally in line with historical observations.
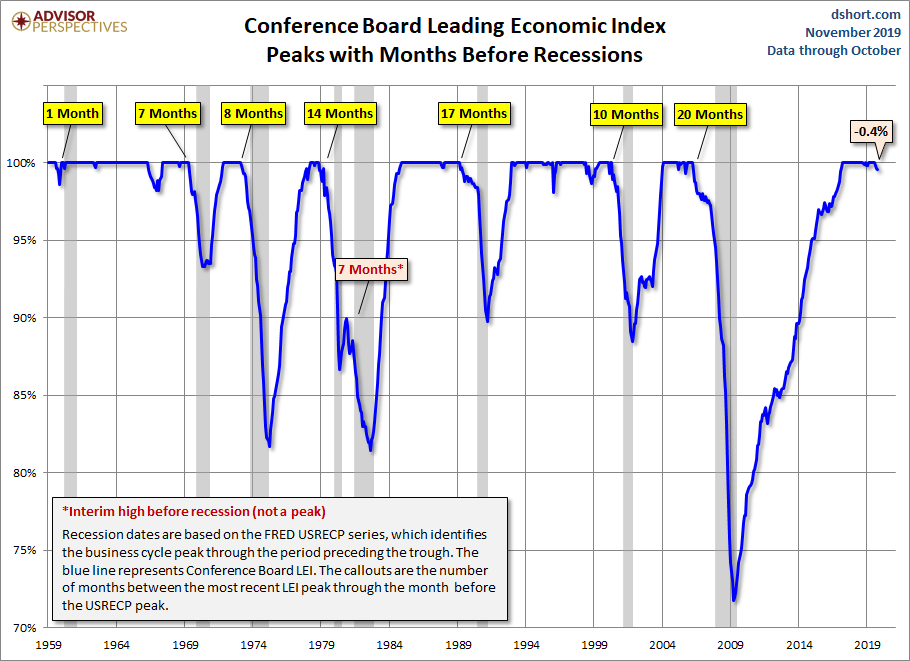
The Conference Board Leading Economic Index (LEI) completes the set of reliable recession indicators. The indicator is a composite of ten economic indicators and peaked on average eleven months ahead of a recession. It warned correctly about seven of the past eight recessions. The signal missed only the second part of a double-dip recession in the ’70s, which might be solely academic as it could have been part of a prolonged recession. Nonetheless, the indicator even peaked seven months before that second dip of the ’70s downturn as the fourth chart shows. The index hit an all-time high three months ago. Historically, the stock market started a cyclical correction four months after the LEI climaxed. The economy went into recession if an average of eleven months passed by without an all-time high in the LEI.

The stock market remains the canary in the coal mine. It missed a few opportunities to confirm the signals discussed above and extended to the upside instead. Meanwhile, several indicators show a record divergence to equities. Someone is wrong, and equities do not have a good track record in contradicting other markets. The upside extension is likely to resolve like a rubber band if equities are wrong again. Technicals send conflicting signals as the vast majority of analysts interpret the most recent market action as a breakout to the upside. They firmly believe that a new bull cycle unfolds. However, we take the contrarian stance and expect a breakout failure. The S&P 500 has been diverging in breadth and momentum for the past couple of years. Its advance within the orange trend appears to be maturing as well. Recent momentum is likely to carry the S&P 500 along a volatile path higher. That may be good news for stock-picking swing traders. However, most long-term oriented investors will be probably very disappointed to see the wheels come off during the next weeks.
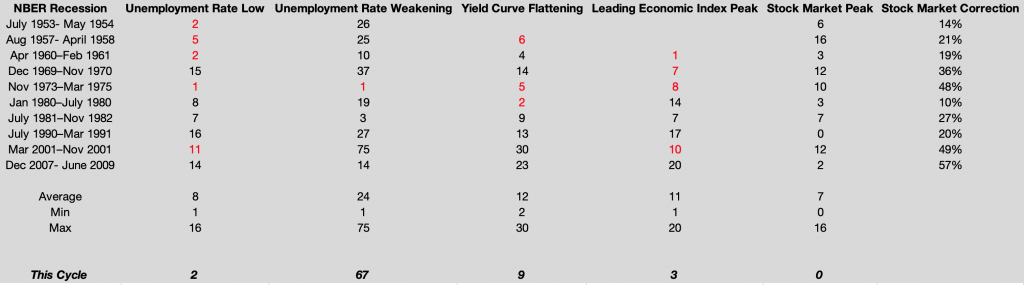
The S&P 500 is on track for a cyclical correction that fits perfectly into historical context. The U.S. blue chips index peaked on average one month after a cyclical unemployment rate low, five months after the yield curve flattened, and four months after the leading economic index peaked. Therefore, an imminent cyclical correction has a high probability according to historical evidence. Moreover, the likelihood of a stock market reversal and a recession increases each day unless the macro indicators reverse for the first time in modern history. Otherwise, investors are probably collecting pennies in front of a bulldozer that picks up speed.
Published on December 4th, 2019