Those who read our latest write-ups know that we have a long-term bearish outlook for the S&P 500. Extremely expensive valuations and evidence of excessive speculation among investors lead to this conclusion. Nonetheless, we have also stressed in the last few write-ups that technicals were intact and likely leading equities higher short term.
Technicals Contradict Fundamentals
Technical indicators remain constructive short term. The recent advance was broad-based as liquidity poured into equities. The following chart from BofA visualizes the dimension of the most recent equity fund flows. More money found its way into equities during the past year than the previous decade. The strong momentum that led equities into the most recent high almost never led to a bear market historically. Hence, technicals continue contradicting fundamentals.

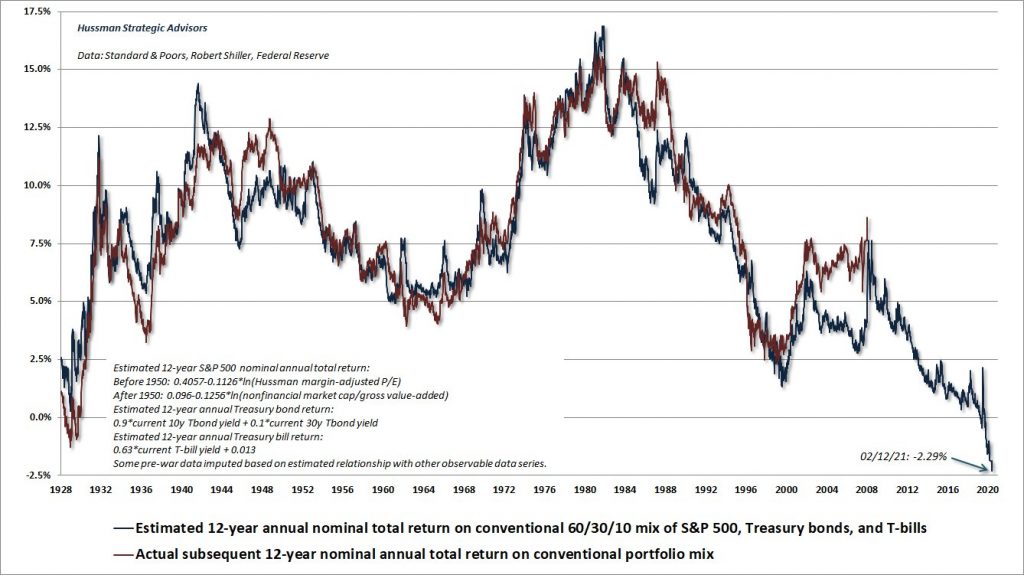
Nonetheless, the fulminant rally since March 2020 is unlikely the beginning of a new bull cycle. Equity valuations across the board are in line with historical (near) end of cycle levels. Hussman estimates future returns of a typical 60/40 portfolio with a proprietary model, which explained past returns well. Traditional wealth management portfolios are likely to disappoint during the next decade, according to their model.
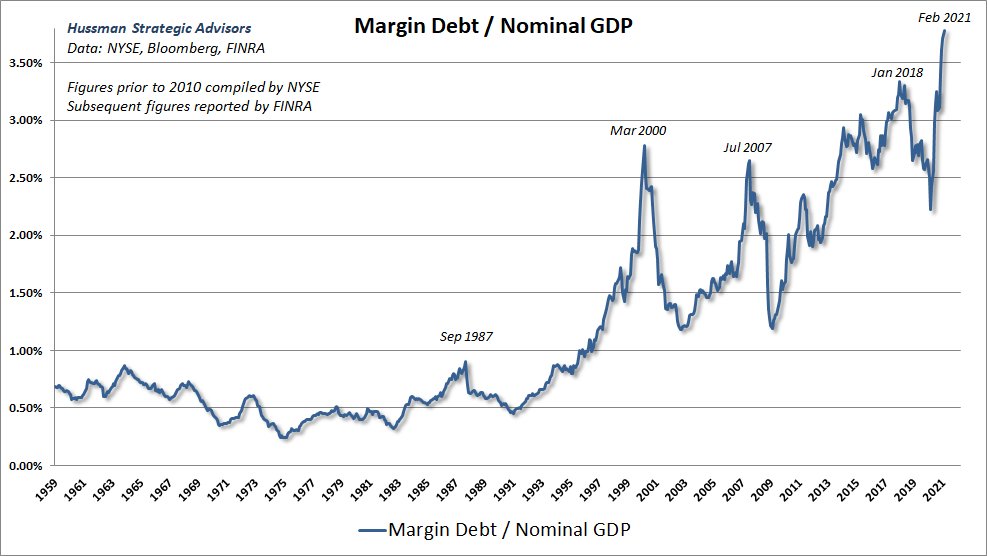
Behavioral metrics, which are most relevant in the medium term, persisted extraordinarily long in an exuberant territory. FINRA data, for example, reveals that a record amount of margin debt built up relative to GDP. The data hints at the fact that there is a substantial amount of leverage in the system. Both fundamental observations have been statistically significant indicators of subsequent negative returns. Moreover, speculative deleveraging tended to unwind quickly rather than slowly historically.
Sell In May & Go Away?
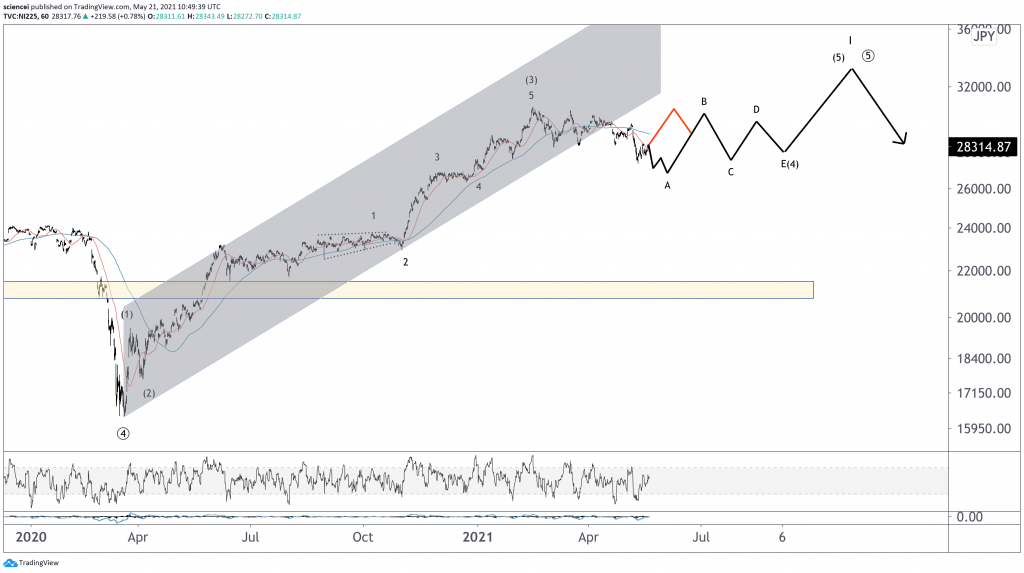
The asset bubble keeps on inflating and there is no technical evidence that the wheels come off yet. Instead, a sideways correction is the most likely short-term pattern. It probably resolves in another leg higher during the summer. The sideways compression is most evident on the small caps index Russell 2000. The chart below blueprints the optimal path during the next few weeks. It shows that the index is trapped between 2,080 and 2,300 points within a triangle correction. Seasonality supports that interpretation as US equities enter a traditionally weak time window during the next few weeks.
Adding all up likely leads to a significant top for some risky assets during May. SPACs, cryptocurrencies, and some tech stocks have probably seen their cyclical high already. The next rally will be interesting. It will probably reveal some form of larger degree divergence across assets. That will hint that technicals are ready to turn bearish as well. Technical projections hint to 10-15% more upside and downside supports to 5-8% correction potential before the rally unfolds.
Conclusion
Strong buying demand recently discards the bearish case short term. However, equities probably won’t continue their rally in a straight line up. Seasonality hints to a single-digit correction in equities before the rally continues.
Nonetheless, it is important to stress the difference between trading and investing. The constructive short-term outlook is a trading and not an investment case. The broad-based market remains extremely expensive. Moreover, the tech sector displays distinct bubble characteristics. The same is valid for interest rates and cryptocurrencies.
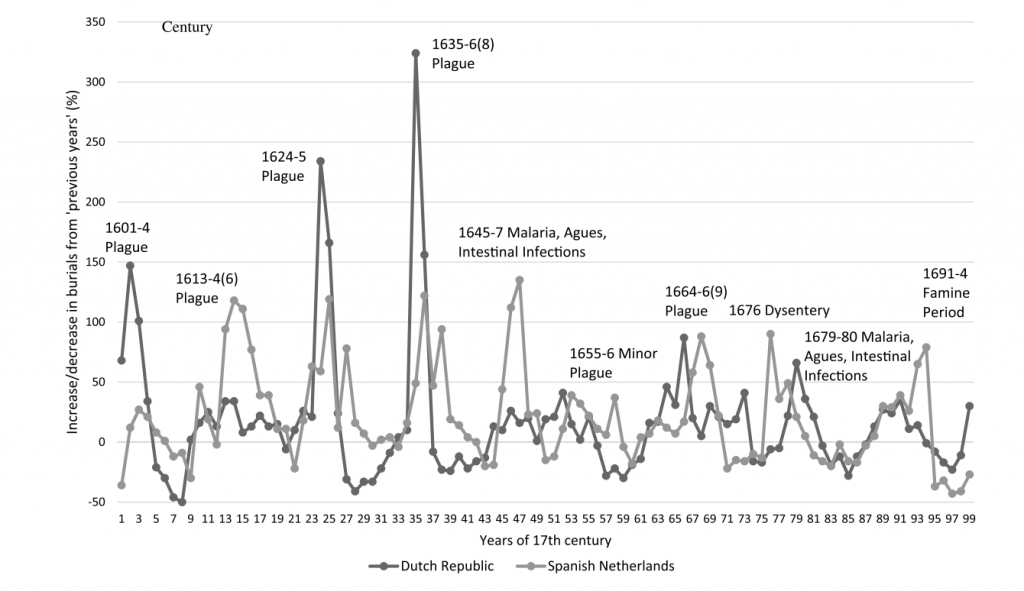
There is a notable parallel between today and the Dutch tulip mania. It was the first recorded asset bubble in 1636-1637 in the Netherlands. Interestingly, the tulip bubble also unfolded right after a plague pandemic hit the Netherlands hard. Today’s bubble is ready to pop once technicals move to the same side of the ledger as fundamentals. The next window of opportunity for bears will probably open during late summer.