US equities recorded the best month of the year this October. A strong rally took the broad-based market to new all-time highs. The first week in November continued just as October ended. NYSE, S&P 500, Nasdaq 100, Russell 2000, A/D Lines, and Value Line Geometric Line finished last week at all-time highs.
The Good
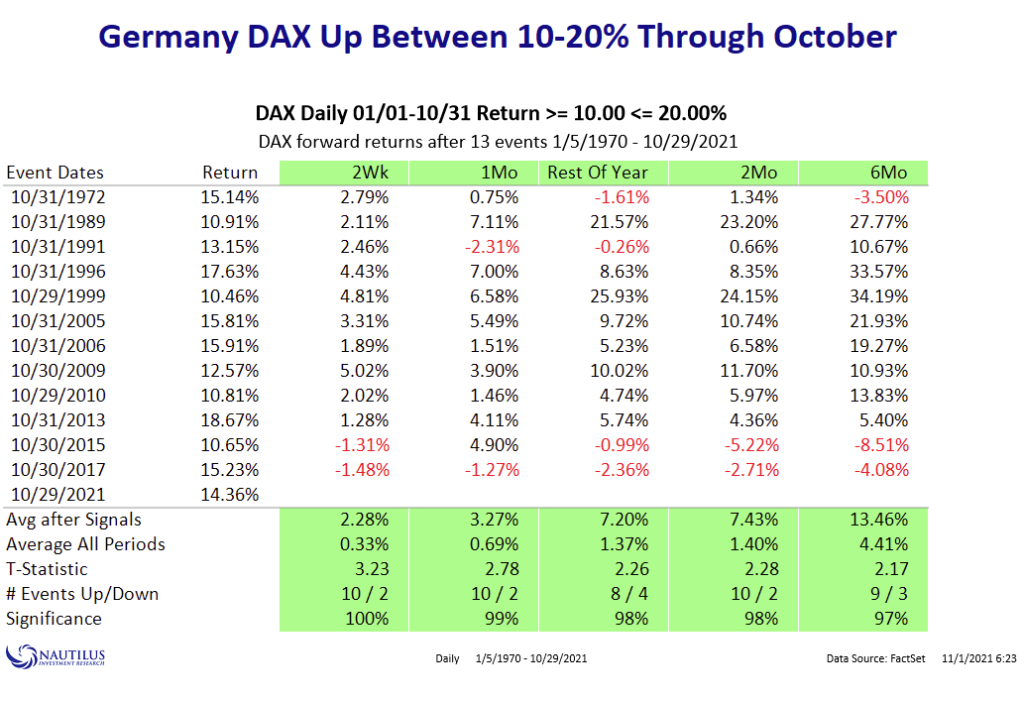
Momentum is strong and that’s good news! The table below shows what happened during the past 50 years after the German stock market recorded similarly strong momentum as it did the past month. It typically continued rallying during the next six months. This time will be unlikely different. US equities are likely to join the party and rally along. Even though technicals may not be as spectacular as abroad, they look constructive in the US as well. Also, the recently relatively weak tech and small caps recorded substantial breadth expansions during October. The key message is that some form of upside continuation is likely.
The Bad
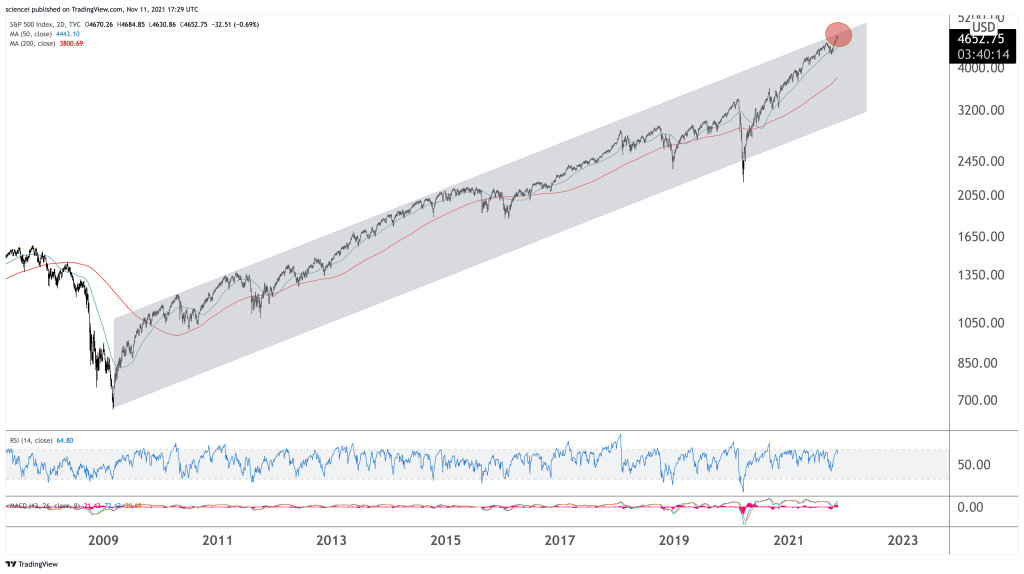
The bad news is that the market is driven by a short interest squeeze and speculation again. Many seem to be jumping on the momentum bandwagon. Sentiment gauges turned quickly extremely bullish again. Market participants are getting greedy and expecting a quick melt-up. However, that could prove difficult as the S&P 500 reached its long-term trend resistance. Nonetheless, sentiment is far from being stretched timewise after the September reset. It will likely remain elevated for another few weeks. Moreover, seasonality is typical positive around this time of the year. That’s another argument against a sharp correction short-term.
Most likely, we see another 5%-6% pullback instead of a melt-up. Meanwhile, momentum on more minor scales continues diverging as buyers seem to be all-in already. That hints at some form of nearby correction. A shallow sideways correction would fit best and lead to a retest of the 4300-4400 area in the S&P 500. Subsequently, at least a final leg higher probably carries the index towards 4900-5000.
The Ugly
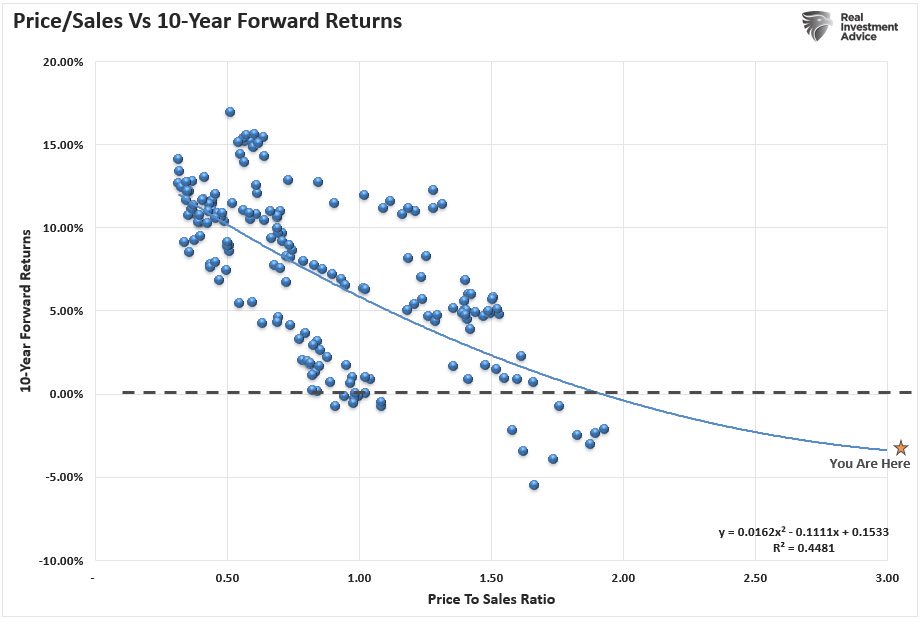
The vast majority of valuation gauges that proved robust have the same message for US equities: They are extremely expensive. Price to sales is one of many examples that plots today’s metrics in a historical context. Plotting that with data from the past decades shows that US equities will probably disappoint going forward. Historically, a similar price to sales ratio coincided with negative long-term returns for the broad equity market. The ugliest aspect is that most long-term valuation gauges confirm this picture. Not many investors expect that and the prevalent narratives remain TINA and the Fed Put.
Energy prices could be a game-changer. There is a compelling case for energy inflation. Political factors don’t mix well with cyclical demand tailwinds and a short-term supply disruption. Moreover, they affect everybody, not just the top 1%-3% percentile, who have wealth to invest in stocks and bonds. Central banks could be identified as the scapegoat due to the loose monetary policy stance since 2007. That might change their equity-friendly policy. Historically, equities did not do well after periods of rising inflation.
Conclusion
All in all, bulls hold the ball firmly in their hands. That’s valid as long as 4300 does not break down sustainably on the S&P 500. However, it may take time until we see progress to the upside on the S&P 500. A volatile sideways market that resolves to the upside fits best to the overall picture. Hence, buying the dip remains the base case strategy. Nonetheless, we are not in a long-term buy-and-hold environment anymore. It’s a trader’s market that needs to be monitored closely.