Preserving purchasing power is the primary reason most long-term investors hold gold. The precious metal did not meet their objective recently as inflation was up 6.8% in the U.S. during November 2021. Inflation has been consistently rising throughout 2021 and we have not witnessed price levels increase as much since the 1980s. Gold corrected throughout 2021.
There is a widespread belief that precious metals protect against inflation. Nonetheless, the past few months are no surprise, as we have laid out long-term evidence of how gold behaved historically. The unambiguous conclusion was that gold is not an inflation hedge on short- and medium-term time frames. Gold preserved purchasing powers over the long term, which are decades. However, some investors, especially retirees, cannot afford to sit through such long corrections.

Moreover, there is little doubt that current fiscal and monetary policy will eventually lead to inflation. Gold will most likely appreciate in the long term. However, that does not guarantee that prices cannot fall short or medium term. Indeed, gold prices can drop by a substantial double-digit amount before the next sustainable rally begins.
Don’t shoot the messenger is a metaphorical phrase for blaming the bearer of bad news. That’s what many readers felt like doing when we warned in April 2020 that substantial evidence signals a significant correction in gold. It is not great to bear bad news, indeed. Nonetheless, it makes sense to present facts so that investors can prepare accordingly. Gold topped four months later and corrects since then. Today, we are probably at another dangerous junction again. Evidence hints again to a situation, which could result in a significant hit to precious metals.
Admittedly, it is unintuitive for most why gold can be bullish long-term but bearish mid-term. However, various forces affect the gold price, and speculative flows dominated most recently. Speculators piled up record amounts of liquidity into gold during 2020. A mini-bubble formed that was unsustainable. Subsequently, speculators got disappointed and some liquidated their positions. Nonetheless, the situation probably persists and the mini-bubble continues deflating. Gold positioning and sentiment are most likely still transitory at the time of this write-up. Cot data shows, for example, elevated but not record positioning. Most likely, we will witness ongoing unwinding until speculators get carved out of the gold market.
Technicals also support the thesis that sentiment remains in the short-term driving seat. From an Elliott wave perspective, an A-wave of minor degree probably ended in early March. It traced probably a motive wave, which implies that downside follow-through is likely sooner or later. The subsequent decline broke below the trend support that guided price action for the past couple of years. It is highlighted as the pale grey trend channel. Gold traded along a choppy sideways path after the trend broke. The precious metal is most likely consolidating before the next leg to the downside begins.
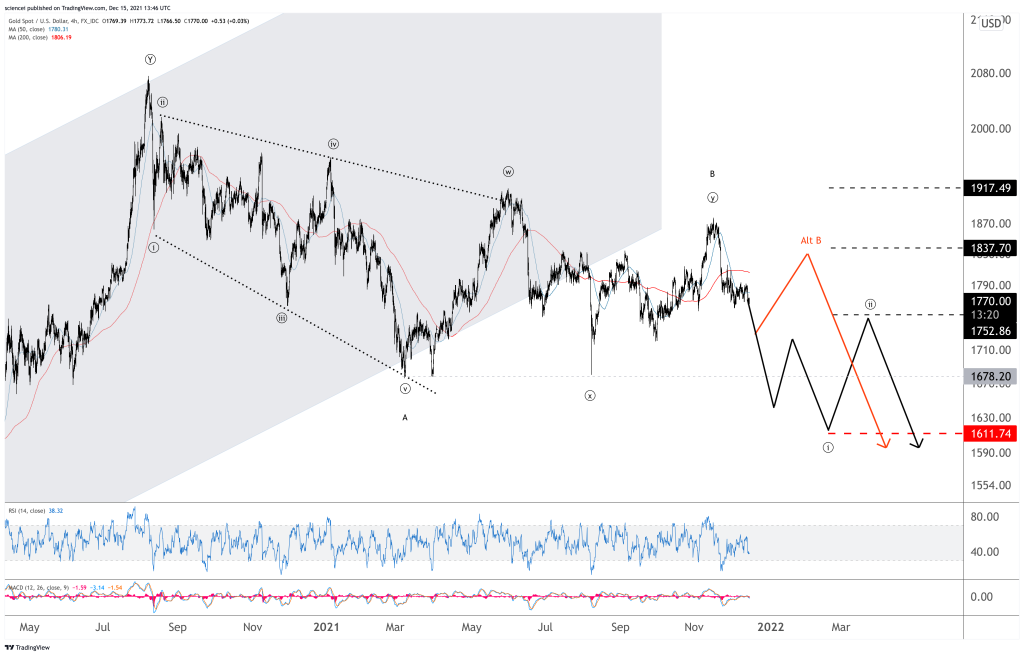
Sideways corrections can take long and follow many different paths. Nonetheless, all of them imply a resolution to the downside sooner or later. The most likely paths are a triangle or double-three sideways correction. Both are depicted in black and red, respectively. Black resumes to the downside sooner and red resumes to the downside later. A sustained break below 1680 signals that the next leg down most likely started already.
The bottom line is that fundamentals are bullish for gold long term. Nonetheless, the story is different mid-term. Speculative positions will most likely continue unwinding and drag gold down towards 1400 or even potentially lower before the next sustainable bull run begins. That conclusion remains valid as long as gold remains sustainably below 1840.