Sentiment indicators became increasingly pessimistic. Some of them are at capitulation levels already. Moreover, technical indicators signal an oversold stock market. Stocks typically reversed to the upside on similar conditions during the past decade.
Nasdaq investor sentiment is a representative example. According to Mark Hulbert, newsletter advisors are as bearish as in March 2020 and December 2018 on the tech index. His metrics reveal a highly aggressive bearish posture among this cohort. It raises the odds of an imminent reversal, leading to the next sustainable rally for tech stocks. Moreover, there is another interesting aspect regarding sentiment. The speed and magnitude of bearishness compared to the extent of the most recent correction. Market participants became very quickly bearish in comparison to recent history. Previously, the market needed to sell off much sharper to make them as nervous as today.

A bearish stance is evident in more cohorts, and professional market participants are no exception. Last week’s reading of Deutsche Bank’s CTA equity allocation, for example, confirms the pessimistic sentiment. CTA managers were net short, just a weak ahead before the selloffs on Friday and Monday. Most likely, their net equity positioning became even shorter during the past week. A similarly bearish positioning among CTA’s has been recorded only on three instances during the last bull cycle of the past twelve years. CTA’s were wrong on each of them.

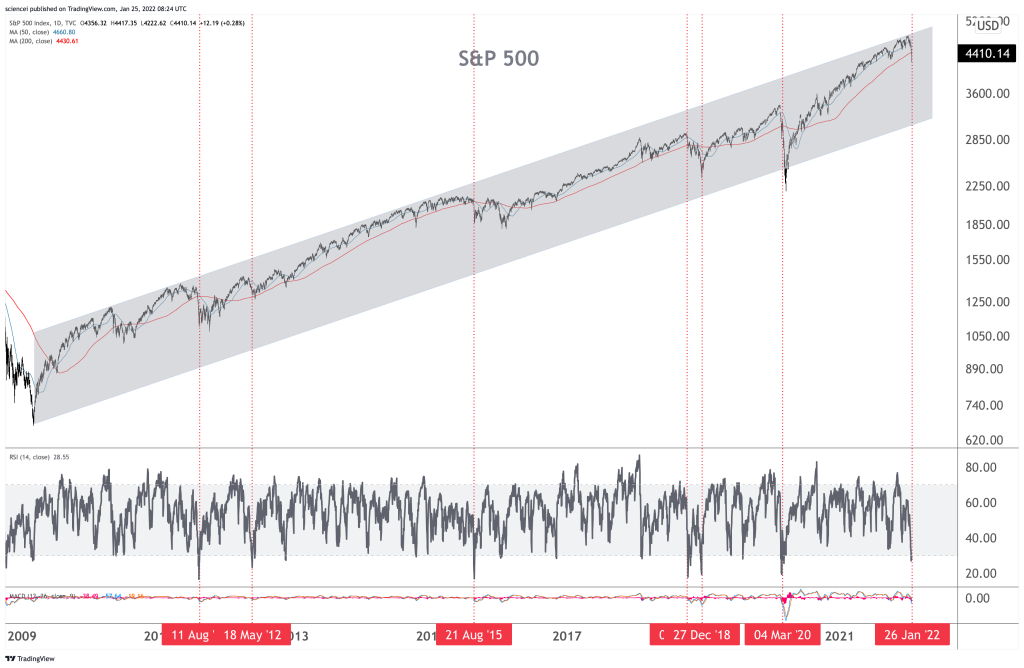
Investors turned bearish as the market sold off sharply. The Nasdaq 100 had a drawdown of 18% from its most recent peak, while the Russell 2000 tanked by nearly 22% on Monday. Stocks are oversold according to technicals. A glance at the S&P 500 daily RSI reveals that it fetched similar or stronger downside momentum on seven instances only during the past twelve years. Trading volume spiked on these instances similarly as during the past few trading days. Six of these seven instances were close to a reversal during that period. While the S&P 500 did not rally immediately, it fell less than 4% on similar conditions. The conclusion is that sentiment, volume, and downside momentum indicate panic selling.
The most likely Elliott wave scenarios confirm that interpretation. A final swing towards 17000-19000 is the most likely scenario within the technical analysis framework. The Nasdaq 100 broke below the bull trend that guided the index higher since September 2020. The most recent weakness counts best as a fourth wave correction. It is likely to find support near the 13880 S/R before the next sustainable rally begins. A sustained break above 14400 increases odds that sellers are done unloading. In that case, at least a double-digit bounce most likely started. The black and red scenarios show how that could unfold. Both eventually lead 25%-30% higher if the Nasdaq reverses near Monday’s low. However, we are not there yet. A reversal has not been confirmed at the time of this write-up. Therefore, a final retest of Monday’s low is likely. Bulls want to see that retest on diverging strength. That signals not only an oversold but also an exhausted correction.
The bottom line is that there is evidence of blood in the streets. Investors were best off buying similar market panics historically. This time will be unlikely different.