The Macro Overlay is an active investment strategy designed to generate consistent returns uncorrelated to other asset classes. It is constructed as a complementary module that enhances the risk/return relationship of traditional investment portfolios. The strategy combines long-term macroeconomic data with mid-term behavioral finance components and short-term technical analysis.
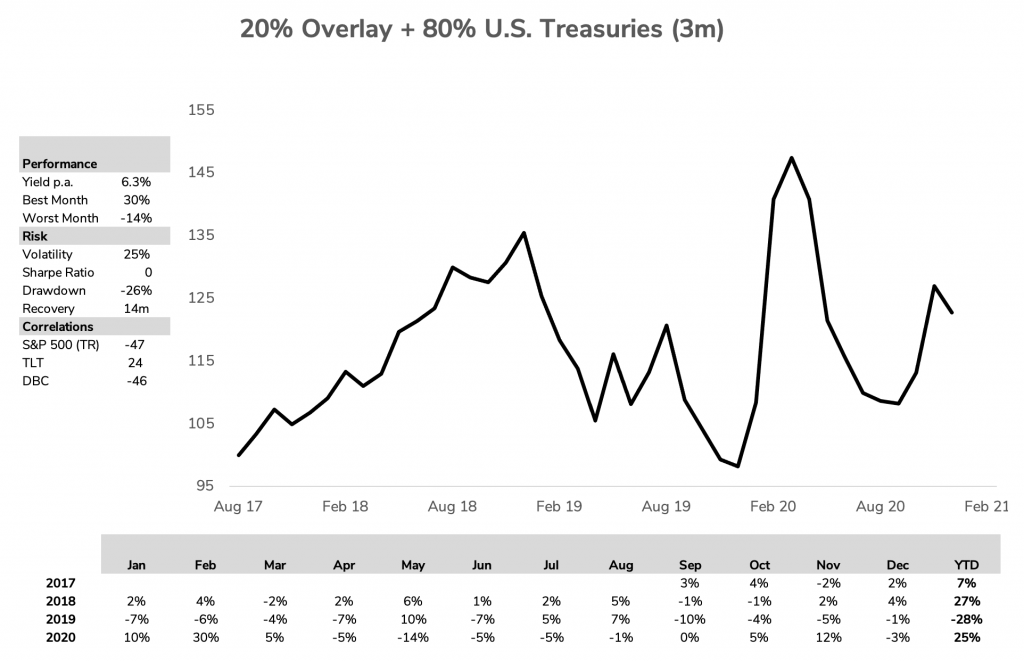
The illustration above shows our portable overlay model portfolio along with a risk-free proxy (short-term U.S. Treasuries). It can be overlaid at various exposure levels to institutional portfolios.
All figures above are based on an 80% allocation to a 3-month U.S. Treasury total return index along with a 20% allocation of our portable overlay. The statistics include a negative contribution of 2% p.a. fix and 10% p.a. performance adjustment.
Warning: Past performance is not a reliable guide to future performance.
This webpage content is not intended to be comprehensive and is designed to provide summary interim information. IT IS INTENDED FOR QUALIFIED ELIGIBLE PERSONS ONLY. It is not a recommendation or investment research and is classified as a marketing communication in accordance with the European Union (Markets in Financial Instruments) Regulations 2017. It does not constitute an offer or solicitation for the purchase or sale of any financial instrument, trading strategy, product or service and does not take into account the investment objectives, knowledge and experience or financial situation of any particular person. Investors should obtain advice based on their own individual circumstances from their own client adviser, where applicable, investment intermediary or other legal or tax advisor before making an investment decision. Further information in relation to the management of potential conflicts of interest is available upon request. These documents are available from ESI Analytics Limited, Merchants House, 27-30 Merchants Quay, Dublin 8, Ireland.
All performance figures are based on the overlay model portfolio displayed and updated on scienceinvesting.com. The model portfolio does not include transaction costs. This data should not be reproduced, published or disseminated in any manner. Although ESI Analytics Limited considers the data to be reliable, no warranty is given as to its accuracy or completeness. Any comparisons against indices are for illustrative purposes only.