An example how our research ideas get implemented is the ESI Long-Short Index. The index and a corresponding tracker has been calculated by an independent calculation agent on a daily basis since April 2022.
Institutional investors could access our ESI Long-Short Model Portfolio until the end 2021. The strategy combines long-term macroeconomic research with mid-term behavioral finance components and short-term technical analysis. It delivered trading signals for a derivatives-based portable overlay. The goal was to generate a high single-digit return with no correlation to beta in every business cycle phase.
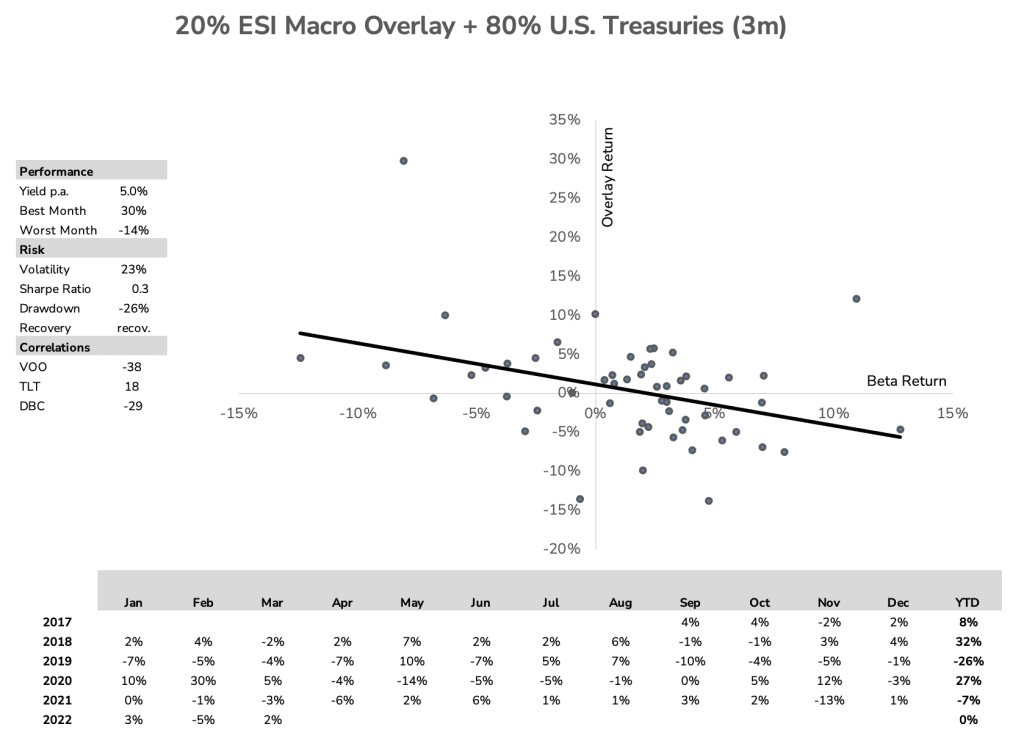
The data below shows the raw data of the macro overlay combined with 3m US Treasuries. All data is before costs and correlated against the VOO ETF. We allow profits to run. Therefore, the drawdown is not representative of the macro strategy at inception.
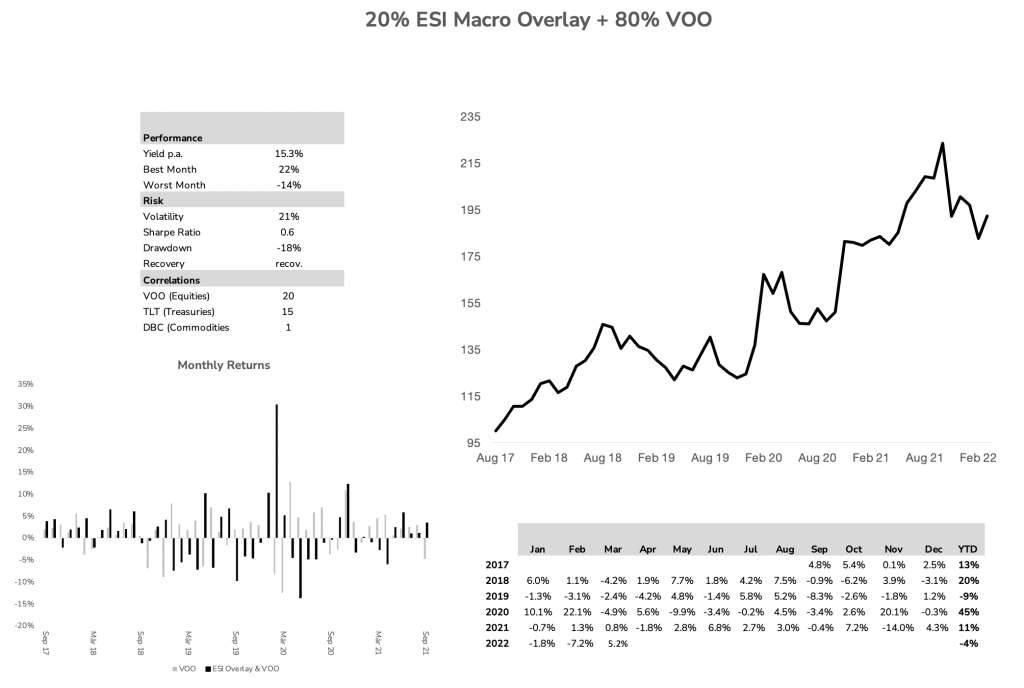
The illustration below shows how the ESI Long-Short model portfolio added value to a beta component (VOO ETF). The embedded overlay model portfolio aims to exploit anomalies in stocks, rates commodities, and currency pairs. It has no bias to be long or short in any market at all times and can be overlaid at various exposure levels.
All estimates above are based on an 80% allocation to the VOO ETF along with a 20% allocation of the ESI Long-Short model portfolio. All statistics below include a negative contribution of 1.25% p.a. fix and 10% p.a. performance adjustment. Any other fees and costs such as brokerage fees, transaction costs, etc. are omitted.
Warning: Past performance is not a reliable guide to future performance.
This webpage content is not intended to be comprehensive and is designed to provide summary interim information. IT IS INTENDED FOR QUALIFIED ELIGIBLE PERSONS ONLY. It is not a recommendation or investment research and is classified as a marketing communication in accordance with the European Union (Markets in Financial Instruments) Regulations 2017. It does not constitute an offer or solicitation for the purchase or sale of any financial instrument, trading strategy, product or service and does not take into account the investment objectives, knowledge and experience or financial situation of any particular person. Investors should obtain advice based on their own individual circumstances from their own client adviser, where applicable, investment intermediary or other legal or tax advisor before making an investment decision. Further information in relation to the management of potential conflicts of interest is available upon request. These documents are available from ESI Analytics Limited, Merchants House, 27-30 Merchants Quay, Dublin 8, Ireland.
All estimate figures are based on the overlay model portfolio displayed and updated on scienceinvesting.com. The model portfolio does not include transaction costs. This data should not be reproduced, published or disseminated in any manner. Although ESI Analytics Limited considers the data to be reliable, no warranty is given as to its accuracy or completeness. Any comparisons against indices are for illustrative purposes only.