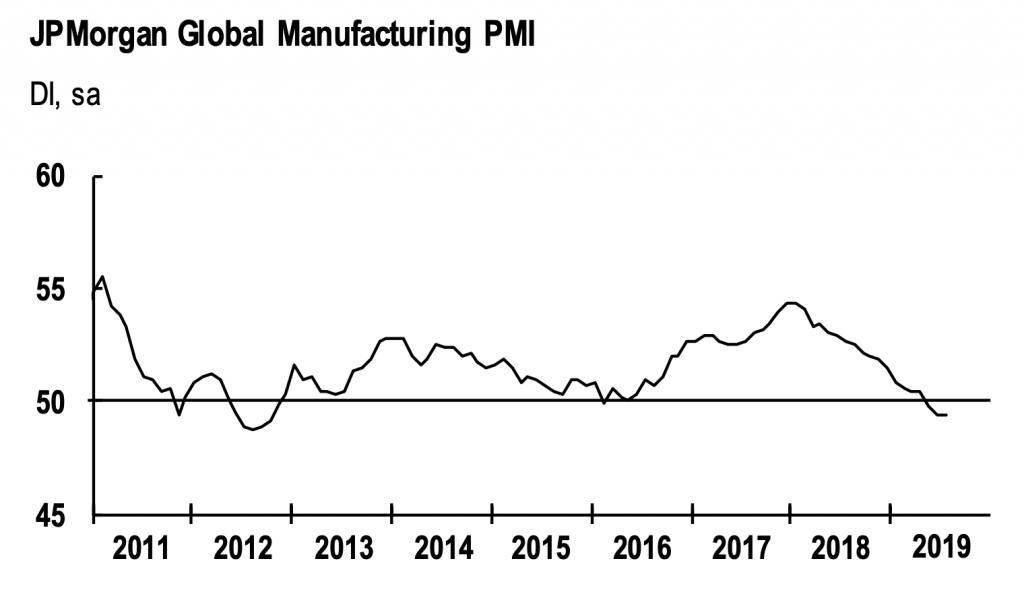
The S&P 500 dropped sharply after the Fed’s FOMC meeting on July 31st. Those who invested on January 26th, 2018 in the S&P 500 did not have any price gains in their account on August 7th, 2019. US equities were in a volatile sideways trend for the past 18 months. Fundamentals deteriorated during that time. Worldwide business conditions worsened as the Global PMI index shows. The PMI is among the most reliable leading indicators for assessing economic activity. It has been trending to the downside since early 2018. Moreover, there is no evidence that hints towards a trend reversal in business conditions as of now. It remains a headwind for the situation in the United States as the global economy is interconnected.

Source: J.P. Morgan / Markit
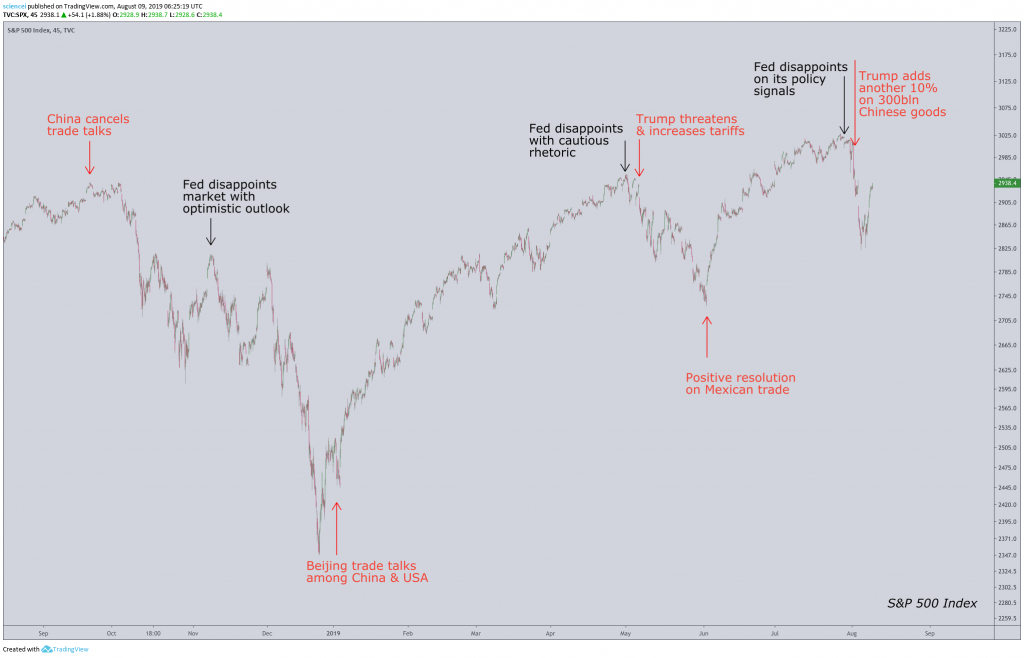
The equity market traded on narratives during that timeframe. Those that dominated were negative. The chart below highlights remarks from President Trump and the Fed that caused significant market moves over the past few months. Both underlying narratives relate to Trump’s trade war and expansionary monetary policy by the Fed. The red arrows point to trade-related events, whereas the black arrows highlight Fed associated events.
The trade war and currency war narrative hit the wires during late September 2018. China retaliated US tariffs and canceled trade talks with the US. The next round of escalation occurred during the first half of May 2019. Trump first threatened to raise tariffs on China and subsequently increased tariffs on US$200 billion worth of Chinese goods from 10% to 25%. The latest escalation happened on August 1st, 2019. Trump surprised the market by announcing another 10% tariffs on an additional US$300 billion worth of Chinese goods despite previous positive statements about the ongoing trade negotiations. Investors were caught offside on all of these events. Subsequently, the market reversed a positive trend and sold off.

A negative narrative works as well in the opposite direction. Hopes on a favorable resolution of the trade war reversed trends as fear dominated among investors. Sharp rallies followed the trade talks among delegations from China and the US in early January 2019 and a favorable resolution on Mexican tariffs during June 2019. Red arrows pointing to the upside highlight both events.
Investors continue to pay much attention to central bank actions. The market has been looking for signs that the Fed implements measures, which extend the longest economic expansion in the history of the USA. It has not happened yet. All of the eagerly expected Fed decisions disappointed market participants during the past year. The Fed did not deliver any extraordinary measures. Instead, most of the announced measures were as expected during the rallies leading to the Fed events. Market participants reacted in a “buy the rumor sell the news” fashion and sold US equities during the weeks after the Fed announcements.
The bottom line is that negative narratives dominated the US equity market during the past 18 months. It happened during a period that recorded deteriorating economic conditions as the current expansion stretches to be the most prolonged in US history. This explains why we warned on July 12th, 2019 that the market sets up a bull trap whereas the vast majority expected a breakout. An ongoing correction remains most likely as long as the prevailing market regime does not change. The Fed was reluctant to act pro-cyclical during the past few months. Most likely, it happened intentionally. The Fed probably wants to preserve its firepower for an economic downturn. Their stance is countercyclical. A similar conclusion most likely applies to the trade war between China and the US. Both sides want to demonstrate strength and have not run out of ammunition. Policymakers on both sides are focused on their economy and financial markets. Therefore, the trade war is probably going to continue in a countercyclical regime as well. The best strategy is most likely an adaptation to the regime. A trading approach will probably continue to outperform a buy-and-hold strategy during the current environment.
Published 08/08/2019
