The cyclically adjusted price-earnings ratio (CAPE) is among the most potent academic finance concepts. It estimated long-term equity returns reliably. 150 years of equity market history is plotted in the first chart below. The broad-based US equity market is currently priced at about a 34 CAPE, which coincided with a negative return during the subsequent ten years.

(Source: calculatinginvestor.com)
The Economic Recovery Is Rolling Over
CAPE’s message is that equities will most likely disappoint during the next decade. Nonetheless, the fundamental concept behind CAPE is not a short-term timing tool. Expansionary growth cycles can extend and theoretically lead from a 34 CAPE to a 40 CAPE by the end of the year. However, those who have read our latest write-ups know that we expect a double-dip impact on the economy. The unfortunate news is that the stock market disappointed in all NBER recessions of the past 170 years and economic activity weakened most recently. The second chart shows Goldman Sachs’ GDP estimates. Growth is deteriorating and rolling over across almost all regions.
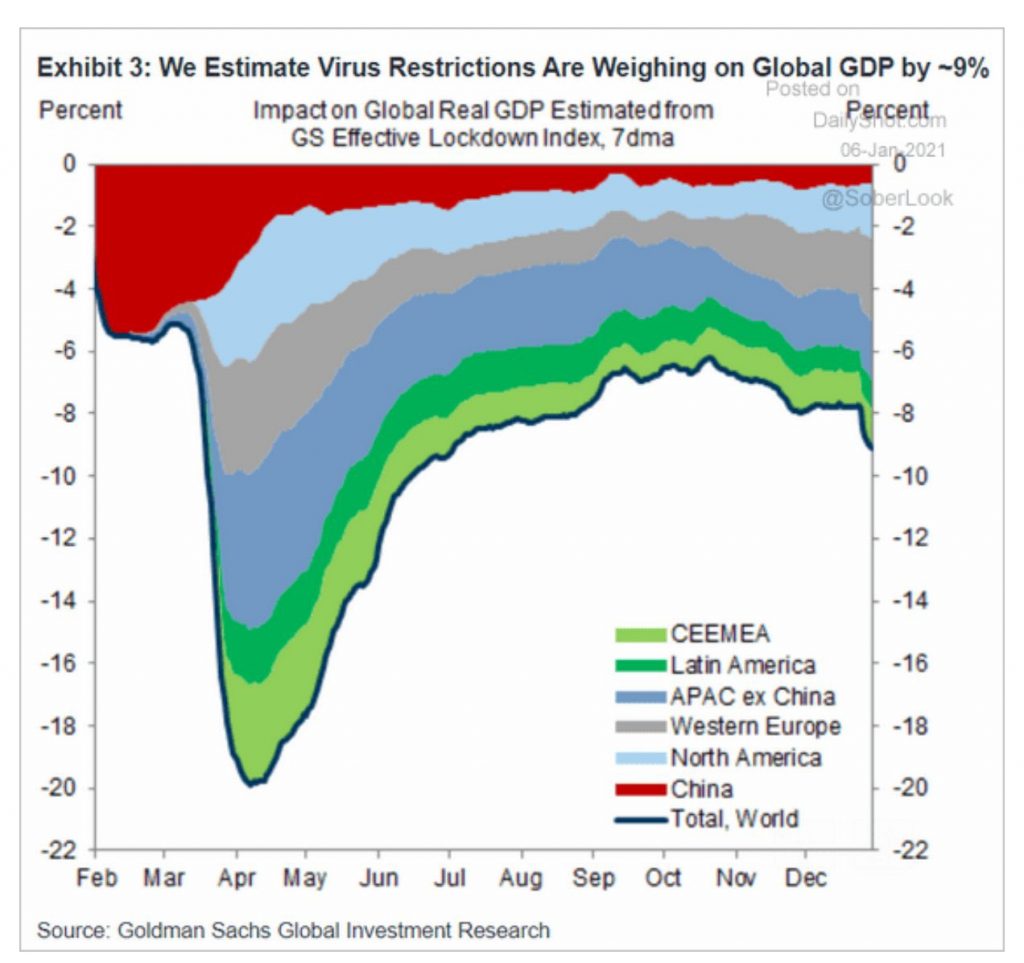
(Source: Goldman Sachs)
The situation around the corona pandemic escalated once again. Large parts of Europe tightened lockdown measures and restrictions. These actions are likely to intensify the recessionary impulse. Infections in the US increased, and more hospitalizations are likely to occur during the next few weeks. The economic situation is extremely challenging. Small business outlook, which is a leading indicator, just had the third-largest drop on record. Unfortunately, the political developments in the US bring headwinds for a recovery. We have a status of substantial political polarization. Half of the country and most elected Republican officials question the presidential legitimacy. That’s the exact opposite of what we need right now: A strong US government, regardless of its political orientation, that can respond well to a massive crisis. There are global implications to that problem, given the US economy’s size. An expansionary cycle unlikely started already. Instead, there is a headwind from the economy for stocks, and similar situations led to double-digit corrections historically. Moreover, similar conditions did not persist for multiple years until rolling over.

(Source: Lohman Econometrics, Bloomberg)
It’s Probably A Matter Of Weeks – Not Months
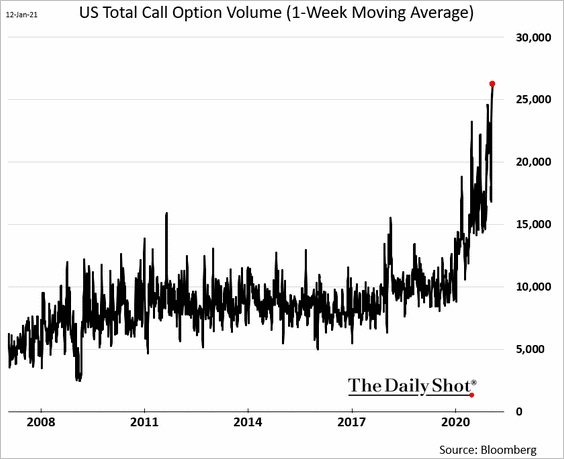
Meanwhile, market participants remain excessively bullish. Sentiment indicators across the board confirm optimism as equities decoupled from the economy. Call option volume is a perfect example. It mirrors that excessive speculative demand is driving the equity market. The traded volumes surged to an all-time high. Call options are among the most leveraged and most risky alternatives to invest in the stock market. Excessive investor optimism levels are associated with subsequently surprising asset returns to the opposite direction of expectations.
Market technicals have been constructive and that could be changing at this junction. The rally that started in March 2020 was broad-based into January. It added more than 70% on the S&P 500 and even more than 90% to the Nasdaq from the March bottom. The advance unfolded in record speed and left no room for any significant pullbacks. However, we have witnessed divergence on multiple time scales lately. That has been an early indicator of an imminent trend reversal historically. It signals that US equities are likely to reverse within the next weeks. A final swing above 3884 remains most likely before the wheels come off.
The bottom line is that fundamentals, behavioral evidence, and technicals are moving to the same side of the ledger. They signal a correction and it will be most likely substantial. The norm has been strong rallies and crashes during the past three years. That’s the new normal as nothing significant changed in or around the market structure. This time is unlikely different and long-term investors are best off outside equities.