Stocks are not done to the upside. Technicals remain constructive despite a likely 5%-10% dip. However, the air is getting very thin for bulls up here. Moreover, the long-term outlook is bearish. Extremely expensive valuations and evidence of excessive speculation among investors lead to this conclusion.
The buy-the-dip crowd is jumping in more rapidly as dips continue to get shorter. Market participants try to buy each drop regardless of its depth. The recovery time from relatively large drawdowns in the S&P 500 is at an all-time low in 2021. It amounts to an average of 2.6 days to recover a 2-sigma drop. Meanwhile, we are still waiting for a 5%-10% drawdown for more than 200 days. That’s more than double the statistical average during the past century.

Exuberant optimism that persists much longer than usual is likely among the most important reasons for the strength. It led to exuberant valuations of US equities. However, not only equities rallied after the corona crash. A broad-based rally in risky assets unfolded during the past 1.5 years. The surprising aspect is its duration and stability. The chart from arbor data science below puts the rally into perspective. It has been the longest rally in risky assets for the past three decades.

Momentum has been constructive, which is supportive for equities short-term according to empirical evidence. Nonetheless, the first few signs appear that hint the wheels could come off. Emerging markets have not confirmed the upside during the past six months, for example. The pattern is not new and could repeat. Emerging markets regularly topped a few weeks or months ahead of US equities during the past few decades. A potential explanation is that investors perceive them as riskier than developed markets. Hence, a risk-off regime tends to commence in emerging markets slightly earlier.

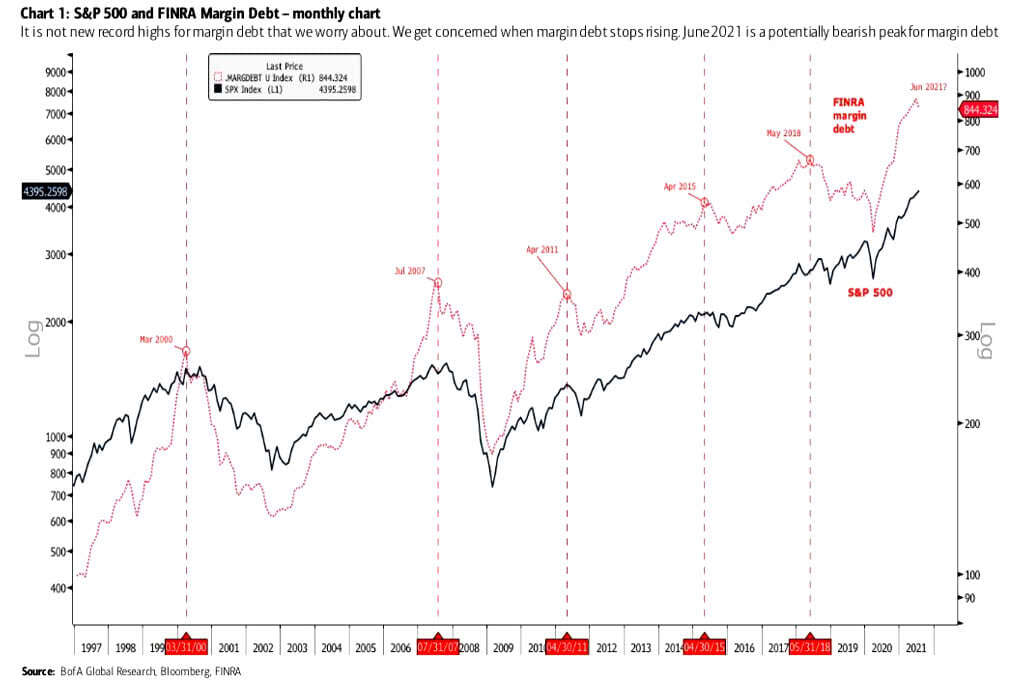
FINRA data reveals that a record amount of margin debt built up to finance risky assets. The data shows that there is a substantial amount of leverage in the system. High margin debt has been a statistically significant indicator of subsequent negative returns. It tended to peak in advance of highs in the S&P 500 historically. Hence, it makes sense to watch for a situation when margin debt stops rising and disconfirms new equity highs.
A long overdue 5%-10% pullback might have started in early September. The S&P 500 has corrected 2% since then. Slightly more downside is likely short-term. Yet, it is probably still too early to call the rally off, which started in March 2020. Some form of upside follow-through remains most likely before the wheels come off. The bottom line remains that equity are priced for perfection. Moreover, speculative positioning is buoyantly off the record. Both have been a red flag historically. Nonetheless, momentum has not been weak for long enough yet. Therefore, a bumpy road is most likely for the next few weeks. Swing traders will probably be rewarded if they remain patient and buy the dip.

