Those who read our recent write-ups know that we made a case to buy the dip. Fundamental evidence motivated the bullish call. First of all, sustained bear markets unfolded during recessions only. However, historically reliable leading macro indicators were not flashing red lights. Moreover, sentiment and position gauges showed pessimistic extremes. Investors held a strongly bearish opinion. However, the data revealed that they were most often incorrect with similarly strong opinions about equities in the past. Therefore, it was not surprising that the major US equity indices unfolded a double-digit rally from their most recent lows.
We witnessed the most significant pullback during the past couple trading weeks since the rally started in mid-March. Pundits proclaim that it is the next leg of a bear market. However, they are likely incorrect again. It is most likely a countertrend correction within the bullish trend that started in March. The main question is how much downside is likely short-term? It depends on sentiment. Put differently, it depends on how fast risk appetite and fear of missing out catch investors who moved to the sidelines recently.
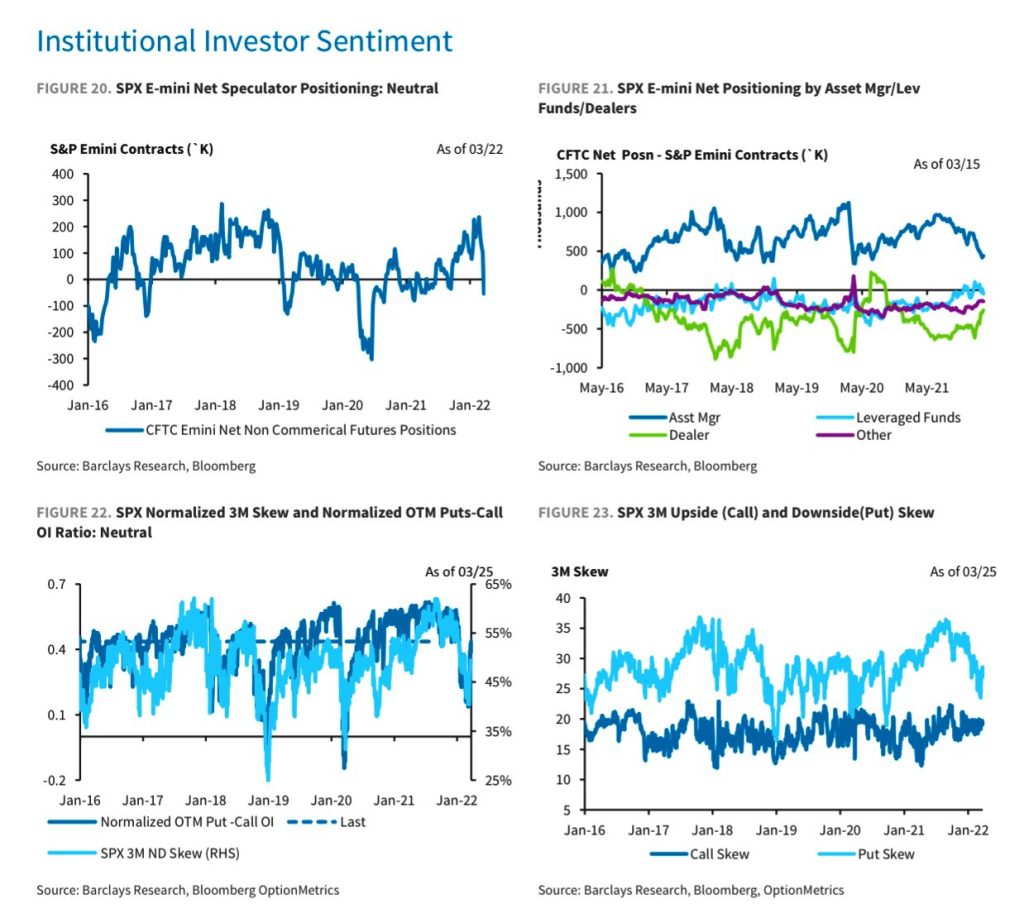
The most recent Investor Intelligence survey recorded slightly more bulls than bears for the first time in a month. The AAII sentiment poll showed as well slightly more bulls than bears. It was the first reading where bulls dominated bears this year. Likewise, institutional gauges did not hint at a convincing sentiment shift yet. Barclay’s data reveals that professional investors are positioned cautiously. All in all, sentiment gauges are transitory and signal more room to the upside.
Technicals remain constructive as well. They are worth a closer look despite skepticism among investors. However, several investors that have been very successful long-term include technical analysis in their decision-making process. Whether one likes technicals or not, they become a short-term self-fulfilling prophecy as billions of dollars from technically oriented and algorithmic traders enter or exit the same position around key levels. Then, liquidity based on technical decisions is no more fiction but a fundamental fact.
A closer look at the most likely S&P 500 Elliott wave structure reveals how the rally could unfold. The most recent selloff is probably a countertrend correction of the most recent rally. Price action bounced from the darker grey trend resistance and remained well above critical support and resistance levels. The recently recorded higher lows marked typical minimum retracements. Therefore, the S&P 500 can march higher at any time if the black path unfolds as a bullish impulse. A sustained breakout above 4600 confirms the black scenario and signals that the next leg higher started already. Moreover, it confirms a 1-2-1-2-3 setup by spiking to the upside within the next few trading days.
The red scenario is the slightly less likely and the best alternative interpretation. It shows how an expanding leading diagonal could form. The red scenario fetches higher odds if the S&P 500 breaks sustainably below the 4500 S/R. Moreover, it carries on below the 4400 S/R and retests the Q1 lows. This selloff could lead to capitulation as most investor sentiment gauges remain somewhat bearish despite the recent rally. Eventually, the expanding diagonal pattern resolves to the upside as well.
Macroeconomic indicators continue supporting a bullish thesis despite deteriorating slightly lately. We will discuss them in more detail again soon. The bottom line is that the rally will likely continue sooner or later. Behavior around key supports will probably reveal more information during the next few trading days.
