“The stock market has predicted nine of the past five recessions” – Paul Samuelson
Significant equity market drawdowns have not always been followed by a fundamental confirmation in form of a recession. Paul Samuelson, among others, recognized this empirical fact long ago. However, a few macroeconomic indicators do have a more reliable track record in signaling recessions than the stock market. We discussed three leading indicators for the U.S. in our most recent public write-up. Interestingly, these indicators often signaled economic weakness even ahead of the stock market.
Labor market conditions, the yield curve, and the OECD leading indicators did a terrific job in forecasting U.S. recessions during the past decades. Altogether, these indicators flashed 46 correct and only one false signal since 1953. The same framework that we applied to the U.S. economy is transferable to the second largest global economic area worldwide – Europe. This write-up discusses the results for Europe and possible implications for the U.S.
The first chart shows historic labor market conditions for the United Kingdom and overlays past recessions. It has the same characteristics as the U.S. labor market: A record job market is a late-cycle phenomenon. Moreover, the German labor market draws a similar picture. A cyclical unemployment rate low, as well as a slow deterioration, occurred in 19 out of 20 instances ahead of a recession if we combine the multi-decade datasets of both European economies.

The German labor market peaked seven months ago and the British labor market peaked nine months ago. Historically, both peaked five and thirteen months on average respectively before their economy went into recession. Hence, the labor market indicator flashes a warning sign for both economies, which is in line with the U.S. labor market.
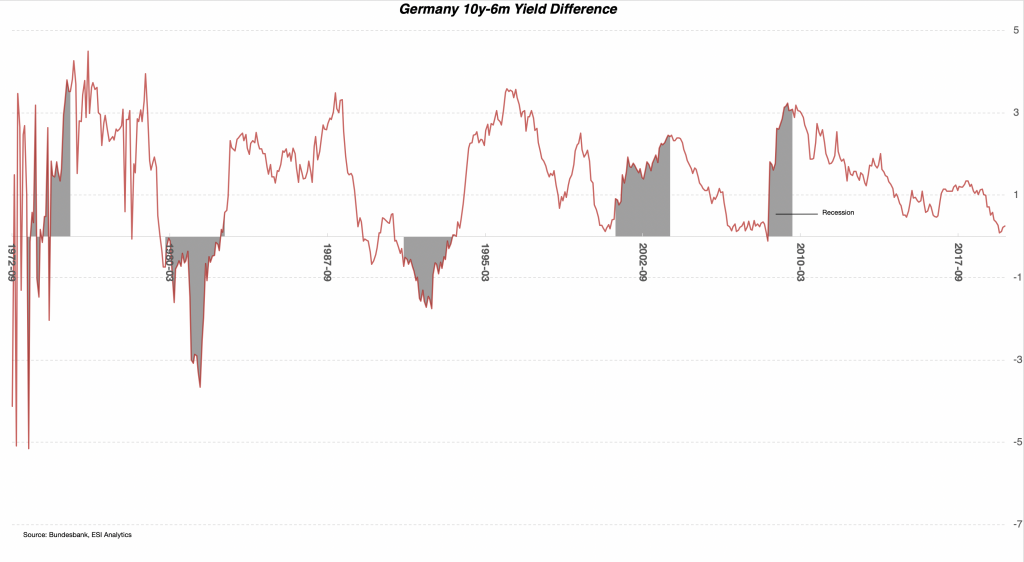
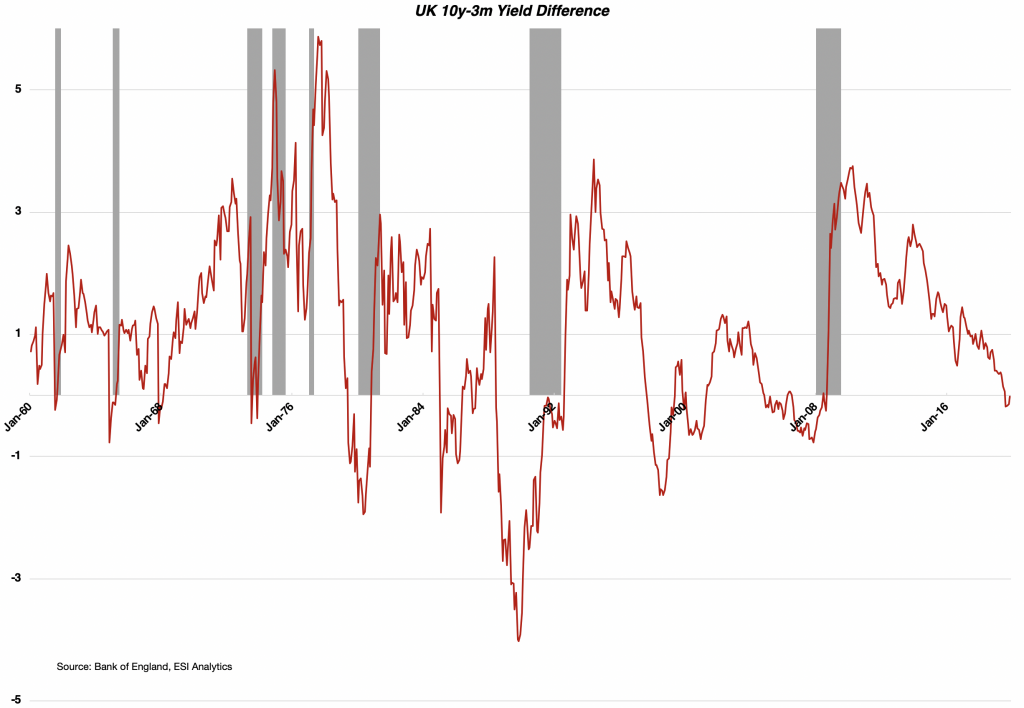
The next pair of charts shows the yield curve of both countries. In the late ’80s, professor Campbell Harvey at Duke University conducted a research on the yield curve and found a significant relationship for an inverted yield curve before the U.S. economy entered a recession. Our indicator, which is a flat yield curve instead of an inverted one, preceded a recession on average by 19 months in the U.K. and 14 months in Germany. The signal failed in both datasets just once and was slightly late in two instances. Nonetheless, 12 signals proved correct historically. All in all, a flat yield curve is bad news for the economy and the signal triggered once again for both economies. The British and European yield curve hit our critical threshold seven and five months ago respectively. Their historical average has been 19 and 12 months flat before a recession kicked in. Again, another reliable indicator sends the same warning signal, which we currently witness in the U.S.
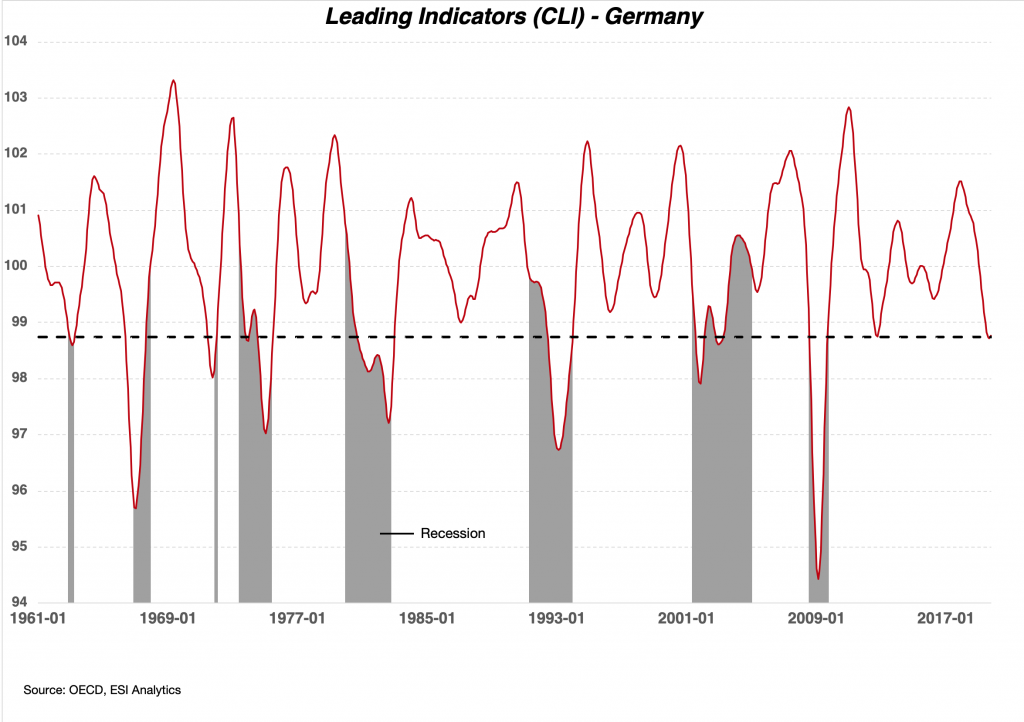
The Conference Board and OECD leading economic indicators complete the set. Germany went into recession on 8/8 instances that the OECD leading indicators crossed below 98.75. It happened again during the past few months after the index deteriorated since the beginning of 2018. A similar picture manifests in the U.K. as the LEI contracts more or less since the Brexit vote in 2016, whereas the CEI loses momentum and shows signs of a rounding top most recently. The British indicator confirms the signals in Germany and the U.S.
Recessions are bad news for the stock market. 29 of 30 recessions in the U.S., U.K., and Germany resulted in double-digit declines for equities. The set of leading indicators presented in this and the last write-up signal a nearby recession for the U.S. and the two largest economies in Europe. Altogether, this hints to a global slowdown instead of a geographically isolated weakness. Most often, global recessions led to more substantial declines in equities historically. The pattern seems to repeat as blue-chip indices show late-cycle characteristics. The FTSE and DAX recorded no price gains since early 2018. Both indices recovered a significant drawdown and increased recently on diverging momentum. The major U.S. indices had a volatile sideways path since early 2018 and rallied sharply throughout 2019. Sentiment became extremely bullish and contaminated professional market participants lately. All in all, a picture that most often appears at the end of the business cycle.

A rational interpretation of the macro and technical picture reveals that a broader correction is most likely for the U.S. and Europe. Historically, equities encountered double-digit losses at similar stages. Therefore, investors are most likely better off on the sidelines instead of sitting through a cyclical correction if the macro indicators discussed above prove correct again.